
Portfolio
Our Work: Delivering Impact Through Data
Explore a selection of projects showcasing our expertise in data analytics, visualization, and AI consulting. From creating custom dashboards to implementing AI-driven solutions, see how we’ve helped businesses achieve their goals.

Data Analytics & Visualization Projects

Company Marketing Insights
This Tableau dashboard, developed using a dataset from Maven Marketing, provides actionable insights into customer profiles, marketing campaign performance, and channel efficiency. By analyzing data from 2,240 customers, it answers critical business questions like identifying underperforming channels, understanding the average customer, and evaluating campaign success rates. Key features include visualizations for customer segmentation, channel performance metrics, and campaign response totals. This project highlights the power of data visualization in optimizing marketing strategies and improving ROI.
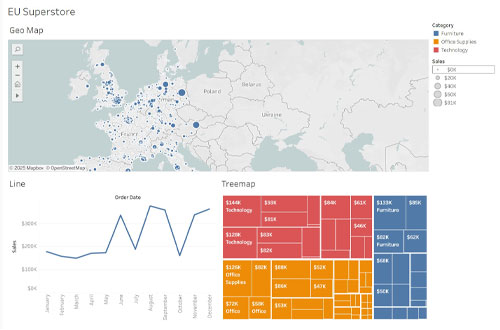
European Market Analytics
This Tableau dashboard, developed from the EU Superstore dataset provided by Kaggle, provides a comprehensive view of regional sales performance across Europe. By combining geo-maps, category breakdowns, and order trends over time, the project uncovers insights into which products, markets, and customer segments drive the most value.
Key features include visualizations for sales by region and category, seasonal ordering patterns, and profitability across office supplies, furniture, and technology. These views help identify underperforming areas, highlight opportunities for growth, and guide resource allocation decisions.

National Test Scores

Global Population
This Power BI dashboard, built using a fictitious dataset from Pragmatic Works, offers a comprehensive analysis of national student test scores. It explores key insights into reading and math performance across various cities, states, and extracurricular activities. By visualizing data from multiple metrics, the report answers critical questions such as which states and cities excel in student performance, the impact of extracurricular activities on math scores, and year-over-year trends in reading scores. With interactive features and actionable insights, this project demonstrates the potential of data visualization to inform education strategies and drive meaningful improvements.
Global population distribution has shifted significantly over the decades, influenced by economic development, education, and regional demographic trends. This Power BI dashboard, built using data from the United Nations’ World Population Prospects, visualizes key patterns across time, geography, and income levels.
One compelling insight from this analysis is that only 9% of the world’s population now falls into the low-income category. Economic growth, improved access to education – especially for women – and overall rising prosperity have contributed to declining birth rates and a stabilization of population growth in many regions. These trends highlight the relationship between financial well-being and demographic shifts.
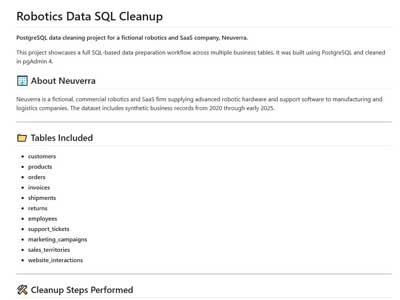
Neuverra: Data Cleanup
Neuverra:
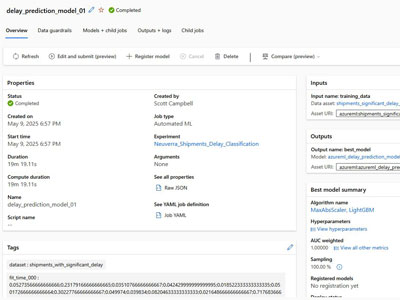
Shipment Delay Prediction
This project showcases a full SQL-based data cleaning process for Neuverra, a fictional, commercial robotics and SaaS company. Using PostgreSQL and pgAdmin, eleven relational tables were cleaned and standardized to prepare the dataset for advanced AI applications. Tasks included resolving null values, fixing inconsistent dates, identifying outliers, and adding realistic behavioral fields such as marketing referral source. This cleanup forms the foundation for predictive AI use cases and business logic modeling. The project demonstrates data preparation techniques and serves as the backbone for future machine learning insights.
This project demonstrates a machine learning classification experiment for Neuverra, a fictional robotics and SaaS company. Using Azure Machine Learning Studio, a shipment dataset was analyzed to predict whether shipments would experience significant delivery delays. AutoML was used to automatically train and optimize models based on features such as carrier, shipping method, and delivery estimates. The final model achieved high performance and showcases the application of no-code machine learning techniques for practical business forecasting.
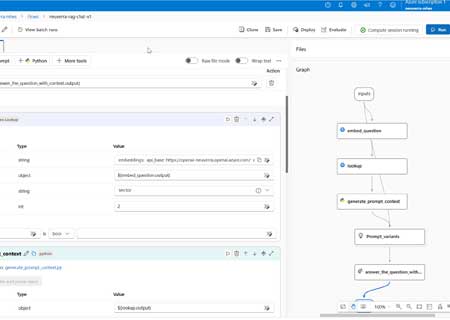
Neuverra: AI Chatbot
Neuverra: Revenue Insights
Development routes inside Azure were explored to build a conversational AI chatbot for Neuverra’s support operations. The chatbot leverages Retrieval-Augmented Generation (RAG) to deliver fast, context-aware answers based on customer service ticket data. Three deployment approaches were developed and tested using Azure ML Studio (Prompt Flow), Azure AI Studio, and Azure OpenAI’s Chat Playground. The result demonstrates how structured business data can be transformed into a conversational knowledge base for internal or external users, blending SQL-based data cleanup with modern LLM technology to support customer service and business operations.
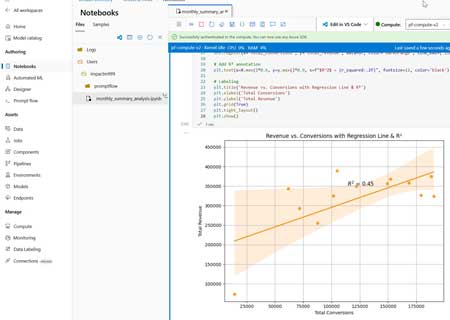
This project explores monthly business performance using a multivariate analysis of Neuverra’s fictional robotics and SaaS data. Built in Azure Machine Learning Studio, this notebook merges and summarizes multiple business metrics – like revenue, conversions, impressions, and quantity per order – into a clear, time-based dashboard. The analysis includes eight executive-level charts with regression, correlation, and conversion rate insights, demonstrating how joined data can yield visual storytelling for better strategic decision-making. It highlights the power of exploratory data analysis in identifying seasonal dips, performance trends, and optimization opportunities.
Neuverra: Marketing
Campaign Analysis
This project applies machine learning to predict the success of Neuverra’s marketing campaigns using Azure Machine Learning Studio and Python notebooks. After preparing and exploring the data with EDA and feature engineering, a Random Forest model and AutoML experiments were used to achieve high accuracy in predicting the success_flag. The model also supports “what-if” scenarios, allowing marketers to test hypothetical campaign inputs (like impressions and conversions) to estimate success likelihood. This project highlights the blend of AI-driven insights and practical marketing metrics for better decision-making.
Neuverra: Marketing
Campaign Insights
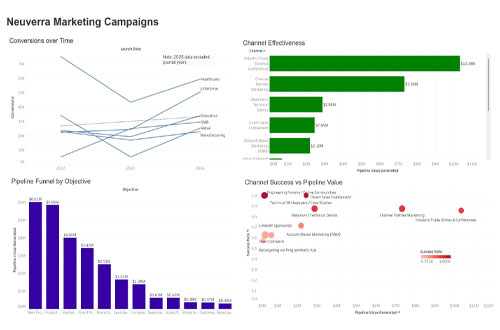
This interactive Tableau dashboard consolidates Neuverra’s marketing performance into a single, interactive view designed for both analysts and executives. By visualizing conversions over time, pipeline value by objective, and success rate by channel, it highlights not only what’s working, but why. The interactive filters allow users to drill into specific campaigns or objectives, making it easier to spot patterns across industries, budgets, and tactics.
The dashboard supports strategic decisions: which investments drive the greatest pipeline value, which channels consistently outperform, and where underperforming campaigns may require reallocation.
Neuverra: Sales
Predictive Analysis
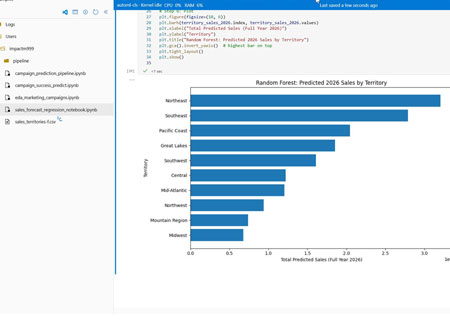
Leveraging Azure ML Studio, a lightweight pipeline was built that forecasts Neuverra’s full-year sales (2025 & 2026) as well as flags to show which regional managers are on track to hit quota. This was all from a synthetic territory dataset. After a quick data-clean step, Random-Forest regressors were trained for revenue and a classifier for quota-attainment. Then insights as tidy leaderboard charts (by territory and manager) plus ROC / precision-recall visuals were developed. The result is a clear, executive-ready snapshot of who’s trending hot and where to focus budget and resources next.
Want to know more about these projects? Let’s Talk.
Neuverra: Sales
Predictive Insights
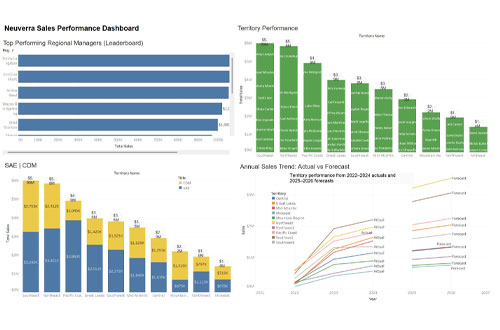
This interactive Tableau dashboard transforms raw, multi-variate sales data and predictive analysis into actionable insights. By combining historical performance (2022–2024) with 2025–2026 forecasts, it highlights territory growth patterns, top-performing regional managers, and the balance between hunter (SAE) and farmer (CDM) roles. The result is a visual command center that makes it easy to spot strengths, gaps, and future opportunities. It’s an executive-ready lens into Neuverra’s sales performance story.